
A causal link between autoantibodies and neurological symptoms in long COVID
Abstract:
Acute SARS-CoV-2 infection triggers the de novo production of diverse, functional autoantibodies (AABs) that remain elevated in Long COVID (LC), but their pathogenic role remains unclear. Using tissue-based immunofluorescence, ELISA, human protein array, and mass spectrometry assays, we identified a broad range of AAB targets among individuals with LC. Individuals with neurocognitive symptoms showed increased AABs against central and peripheral nervous system proteins. Purified IgG reacted with human locus coeruleus, thalamus, adrenal gland, thyroid, and cross-reacted with mouse sciatic nerve and meninges. CNS-reactive AABs correlated with several neurological symptoms. MED20-targeting IgG from patients with LC showed enhanced antibody-dependent phagocytosis. Passive transfer of IgG from individuals with LC into mice induced fatigue-like behavior, loss of balance/coordination, thermal hyperalgesia, small fiber nerve damage, and increased pain-related neuronal activity, recapitulating patients’ symptoms. These findings suggest that targeting AABs might offer therapeutic benefits for this LC subgroup.
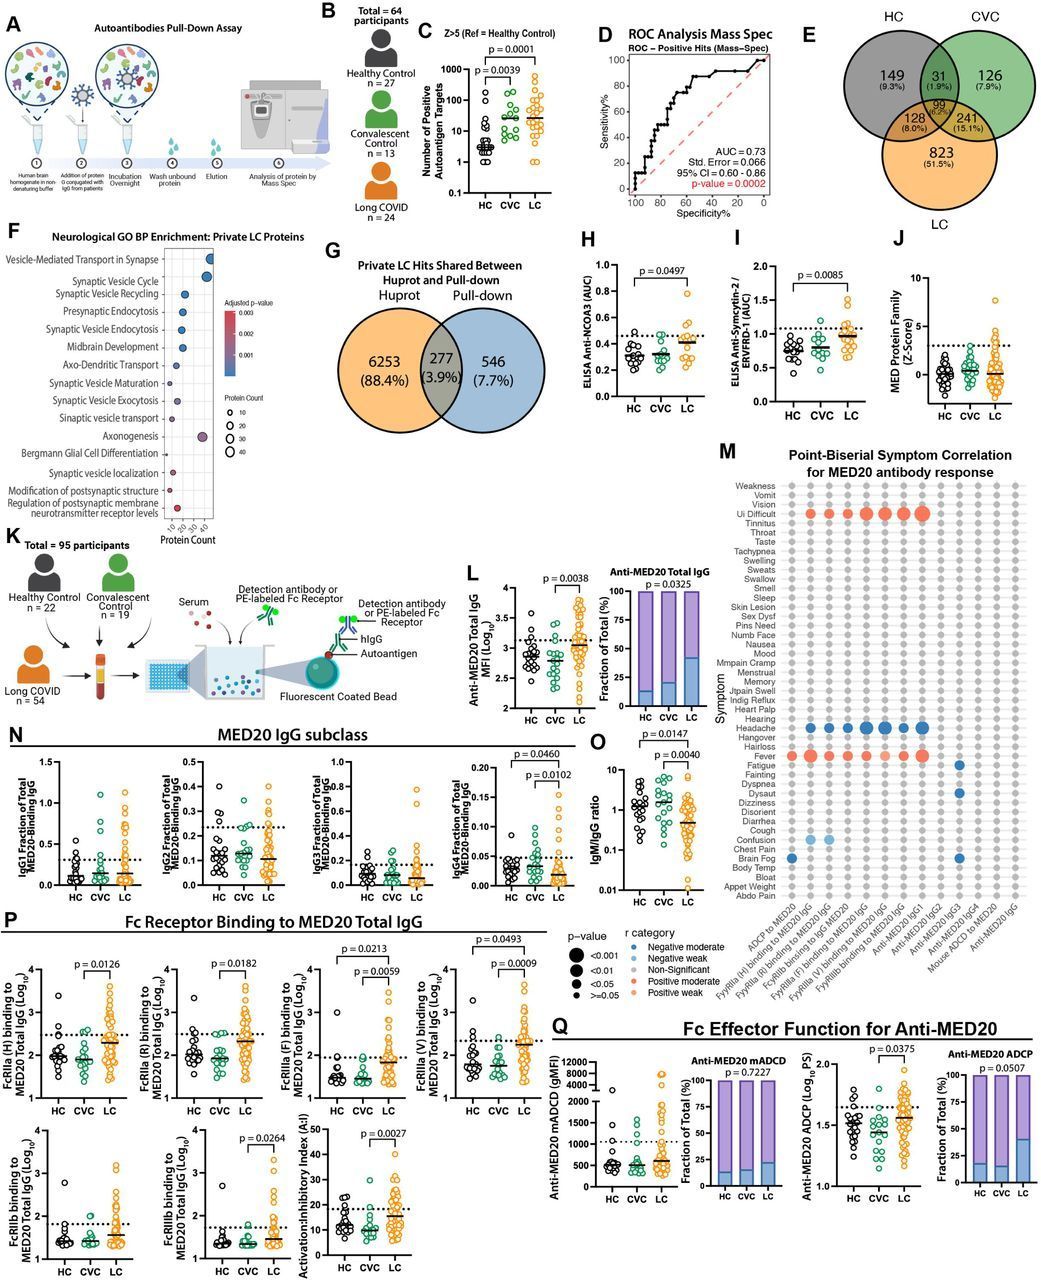
Figure 4.Autoantibodies validation and association with symptoms.
A-B. Number of samples per group that were used to perform a pull-down of autoantigens using human brain homogenate, followed by mass spec. C. Number of auto-reactivities for each person within each group, starting at an intensity threshold of Z-score > 5. P-values are described in the figure and were determined by the Kruskal-Wallis test followed by post hoc Dunn’s test. D. ROC analysis of the number of positive hits identified by mass spectrometry (MS). E. Venn diagram showing the number of shared and private positive hits between groups. F. Pathway enrichment analysis on the private neurological hits identified in individuals with Long COVID. G. Venn diagram showing the number of shared and private positive hits between Huprot and pull-down, followed by mass spec. H-I. ELISA validation of autoantigens showing Area Under Curve (AUC) analysis for top hit targets identified by Huprot (NCOA3 and Syncyting-2). Each dot in the figure represents the value obtained from an individual person. J. HuProt Z-score for proteins that belong to the Mediator (MED) Family. K. Number of samples per group that were used to perform the effector function analysis for anti-MED20. L. Luminex assay measuring MED20-specific total IgG. M. Point-Biserial symptom correlation for anti-MED20. p-values were adjusted for multiple comparisons using the Benjamini-Hochberg method, FDR method. Significant associations were visualized in a dot plot and color-coded by r category. N. Luminex assay measuring MED20-specific total IgG subclasses. O. Anti-MED-20 IgM/IgG ratio. P. Binding of specific MED20 IgG to individual Fc Receptors (FcγRIIa (H); FcγRIIa (R); FcγRIIIa (F); FcγRIIIa (V); FcγRIIb; FcγRIIIb) and Activation:Inhibitory (A:I) index calculated as (FcγRIIA-H131 + FcγRIIA-R131 + FcγRIIIA-V158 + FcγRIIIA-F158 + FcγRIIIb) / FcγRIIb. Q. Fc Effector function analysis for anti-MED20 showing geometric Mean Fluorescence Intensity (gMFI) for mADCD and log10 phagocytic score (PS) for ADCP. Each dot represents one individual. Dashed lines indicate positivity thresholds defined as the mean of HC ± 2 SD. P-values are described in the figure and were determined by the Kruskal-Wallis test followed by post hoc Dunn’s multiple comparisons test.
Authors:
de Sá K, Silva J, Bayarri-Olmos R, et al.,
A causal link between autoantibodies and neurological symptoms in long COVID, Cell, 189, 3214-3235.e37
Journal:
Cell